Video analytics for multi-site operators

Every camera becomes a source of business intelligence.

VideoBI turns video streams into datasets, and datasets into dashboards for executives, managers and frontline teams. Across restaurants, warehouses, properties and job sites.
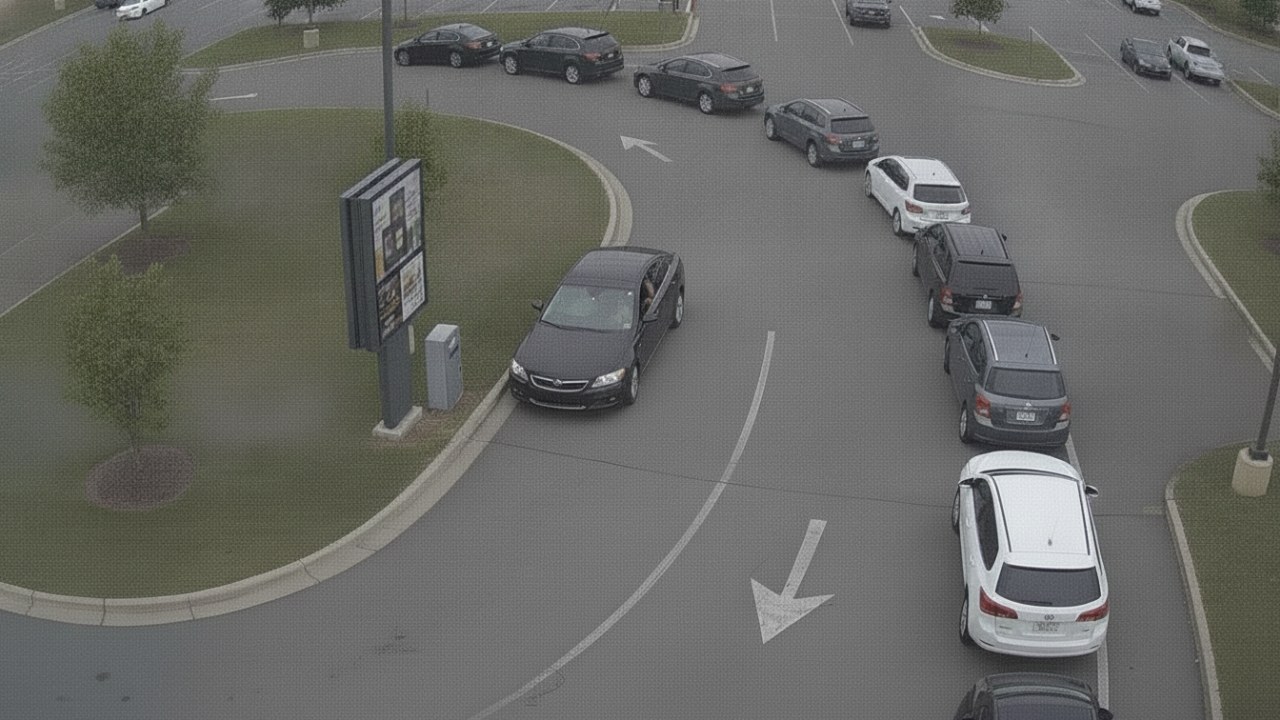
Drive-thru lane cameraQSR · Drive-thruLane 9 cars · avg 3:42
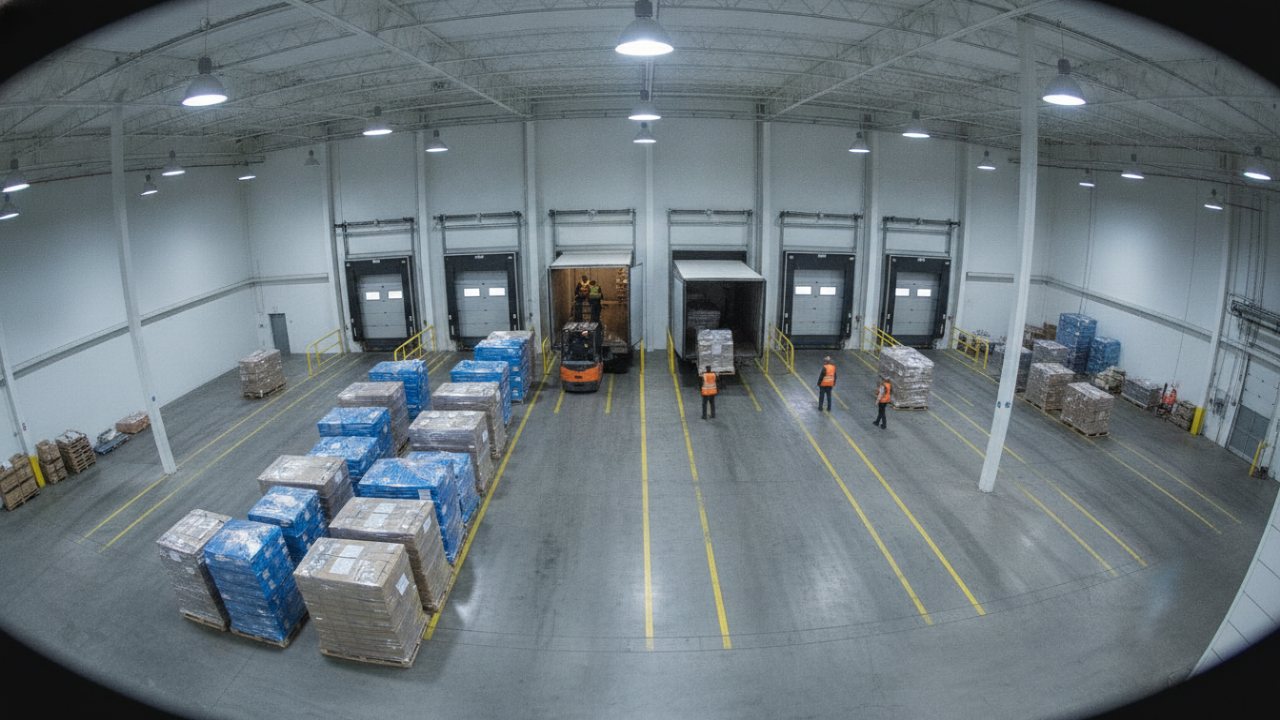
Loading dock cameraLogistics · DockDoor 7 · waiting 48 min
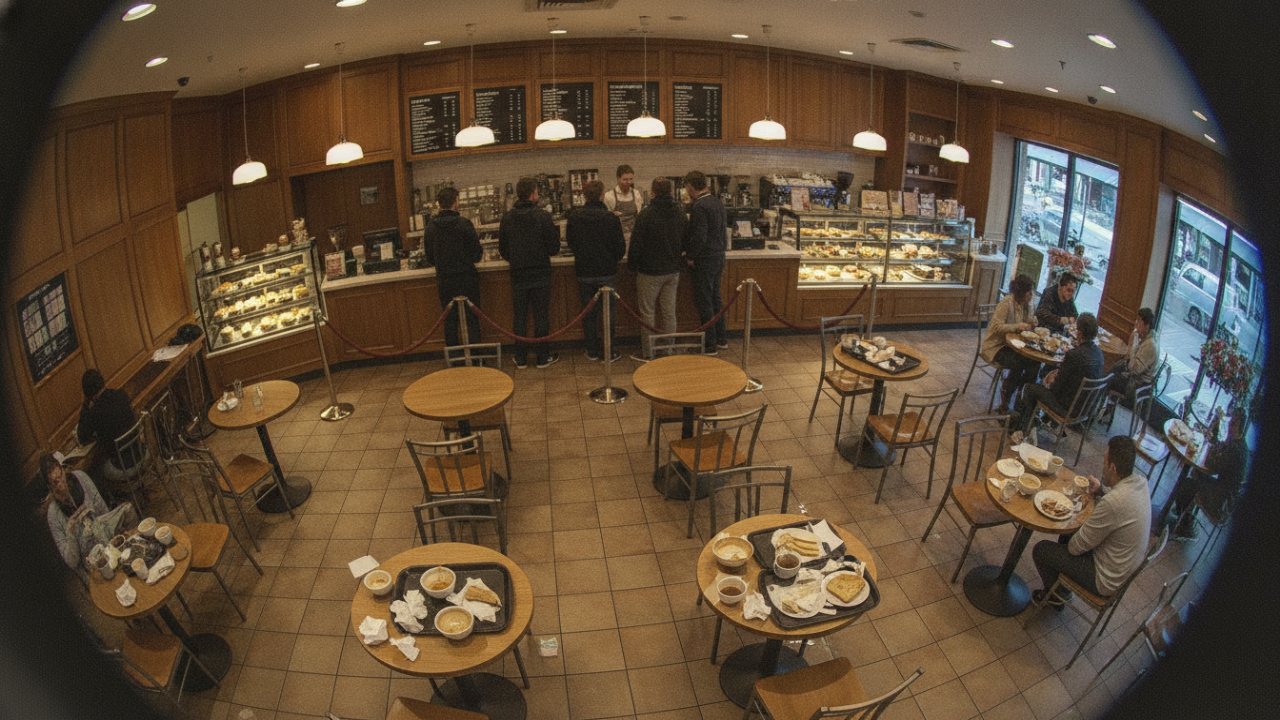
Café lobby cameraQSR · CounterLine 5 · 2 walked out
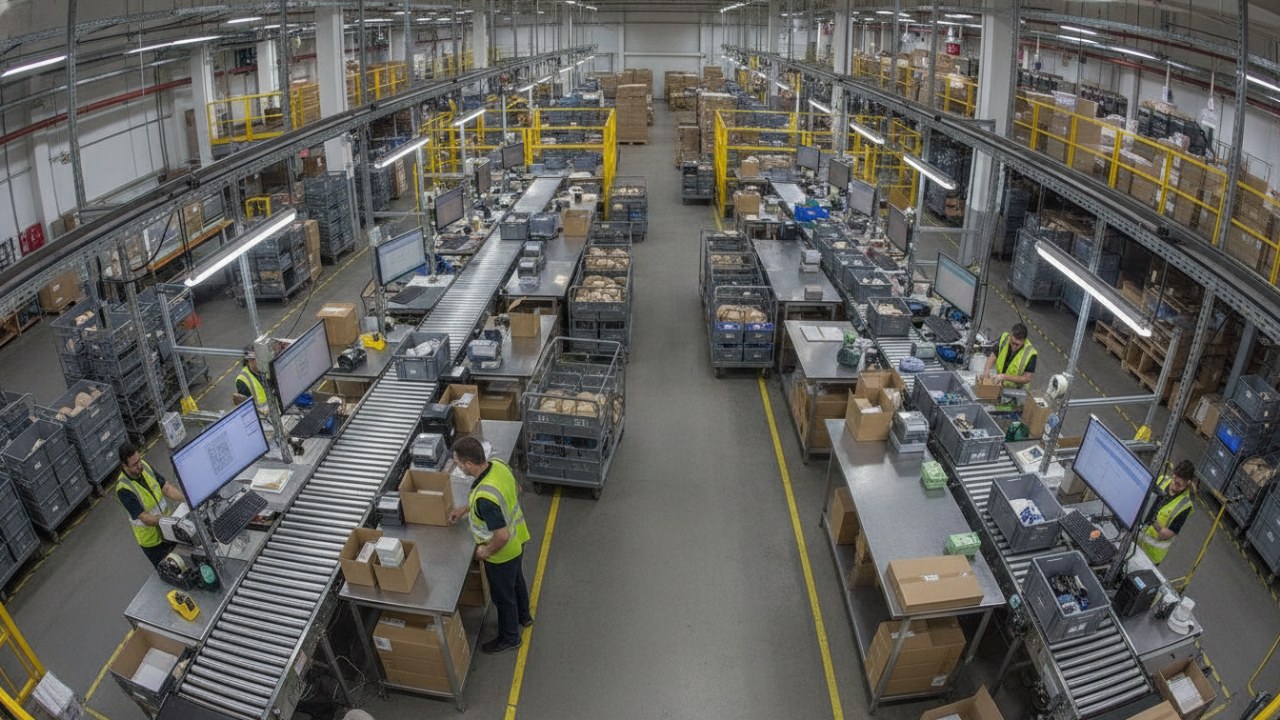
Pack line cameraLogistics · Pack linesLine 1 · no totes 14 min
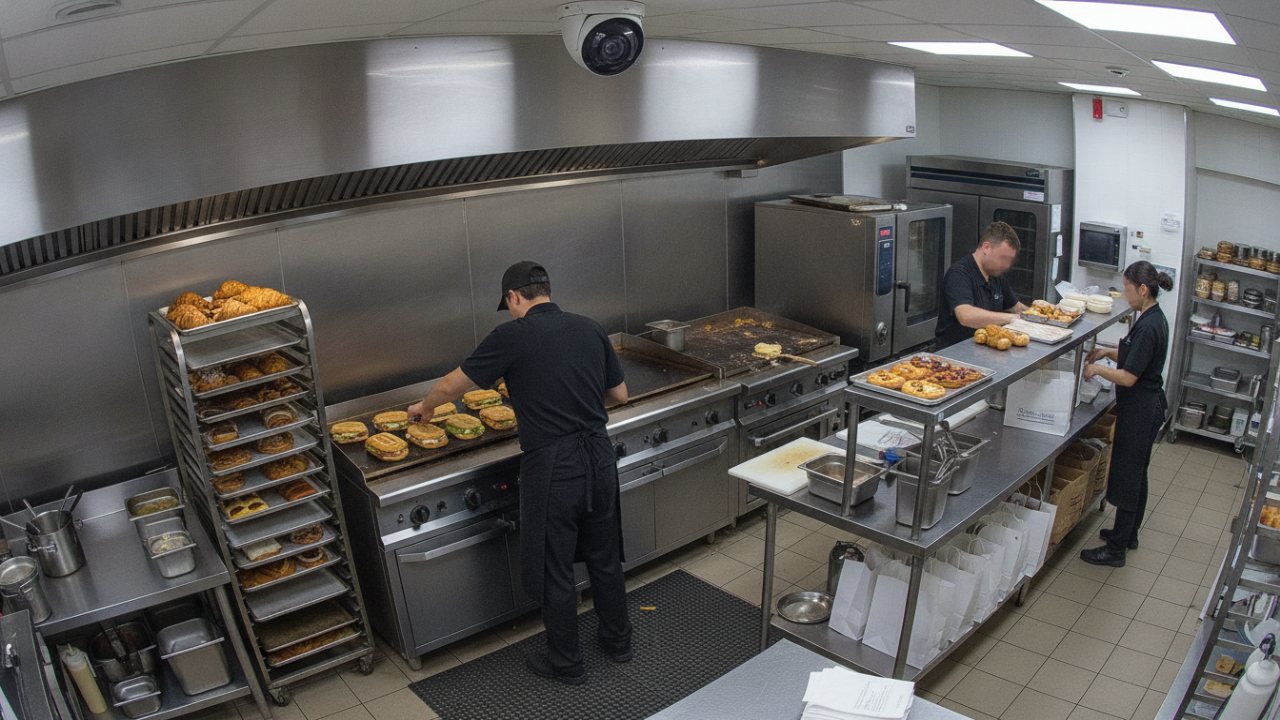
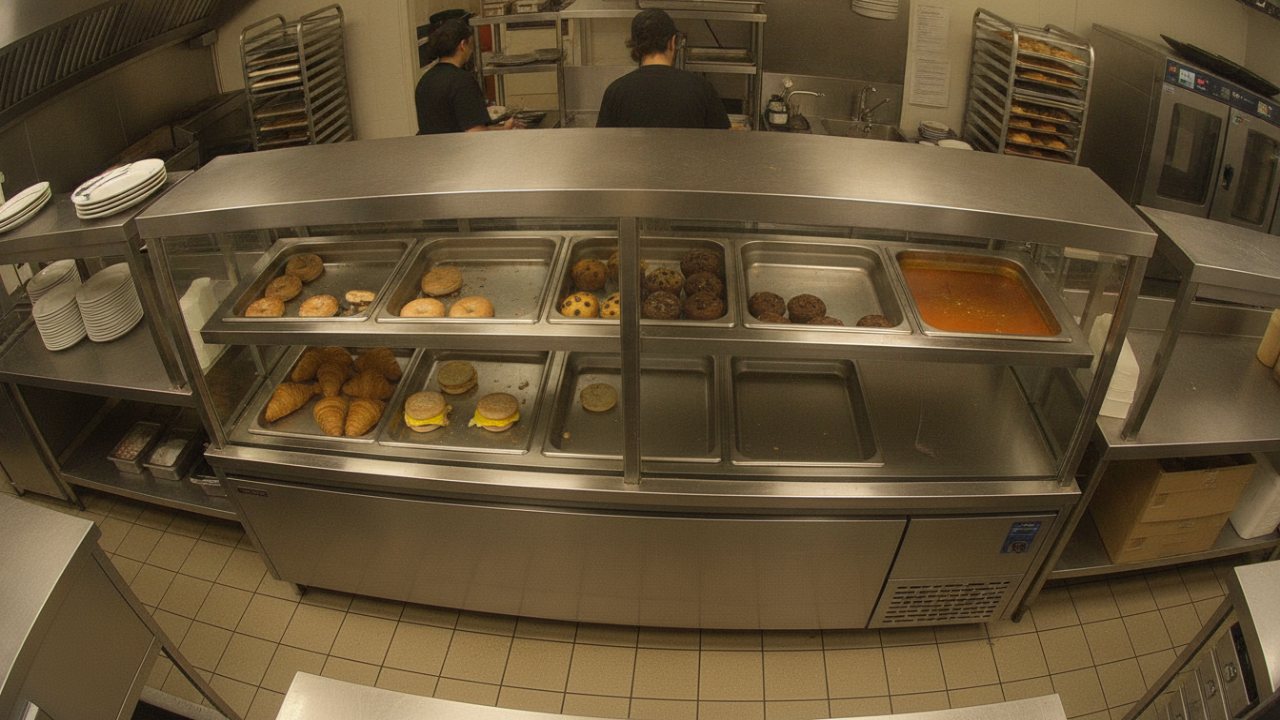
Restaurant kitchen cameraQSR · KitchenMac & cheese · 3 of 12
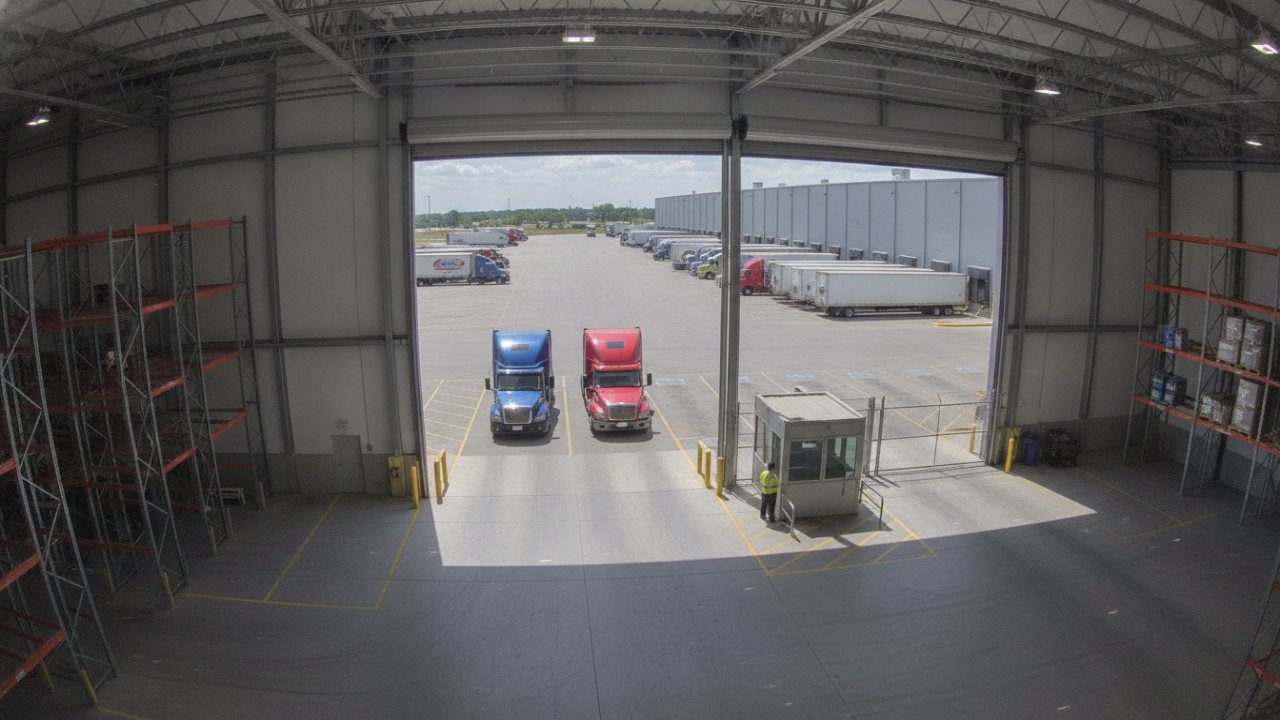
Truck yard cameraLogistics · YardYard 84% full · 11 trucks

Dataset ● streaming

12:41:07 qsr.store_7 counter.line 5
12:41:06 dc.memphis door_7.wait 48m
12:41:05 qsr.store_45 dt.lane 9
12:41:03 dc.memphis line_2.idle 14m

This month all sites

$869Krecoverable a year, logistics sample
$48.9Krecoverable last week, QSR sample

Ask AI

"Is our detention the carriers' fault or ours?"
53% is ours: crews start late on 2nd shift at DC Columbus, a median 88 minutes after docking.
The platform

From the stream to the decision, in one system.

Video is the most detailed record a physical business keeps, and little of it is ever used as data. VideoBI reads it on site, keeps what matters as structured data, and puts it in front of the person who can act.

01 · CAPTURE

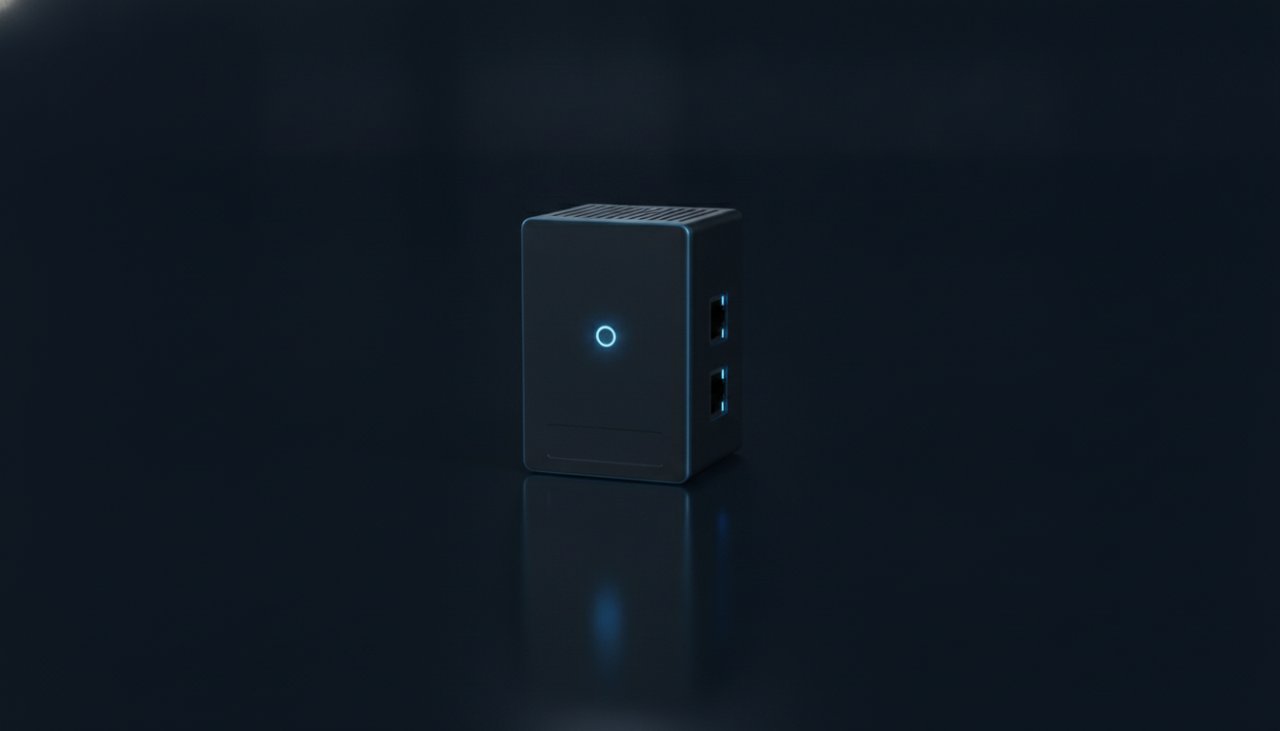
On-site edge devices →

A device at each site reads its cameras locally, and the video stays in the building.

  • Works with the cameras you already have; kits add ours where needed
  • Zones drawn per camera: lanes, docks, doors, lines
  • Stills and clips only when you ask for evidence
02 · STRUCTURE

Governed datasets →

Every site writes the same schema of readings, rolled up every fifteen minutes.

  • A catalog of defined metrics, per industry
  • Your business rates turn hours into dollars
  • Query it, export it, or join it to your ERP and POS
03 · ACT

Dashboards, alerts, answers →

The same numbers, shaped for each level of the organization.

  • Executive packs in dollars, site against site
  • Manager lists: what to fix today
  • Wall boards and alerts for frontline crews
  • Ask AI, with the evidence behind each answer
Video AI

State-of-the-art video AI, built to run at every site.

The most capable video AI models teach small, fast ones. VideoBI fine-tunes compact models for each task and runs them on the edge device at every site, so each camera becomes a reliable source of data, in real time.

  • Frontier models as teachers. The largest video models label and describe footage at a scale no team of people could.
  • Fine-tuned for the edge. Small models trained for one job each, compressed to run on every stream in the building.
  • Benchmarked before they ship. Every model is scored against hand-counted video, and a new one ships only when it beats the one in the field.

How our video AI works →

In trainingFrontier video modelsThe most capable video AI models label and describe footage at scale. People review the hard cases.
In trainingFine-tuningCompact models learn one task each: a queue, a pan, a dock door, a trailer, from every camera angle we see.
On siteEdge modelsCompressed to run in real time on every stream, on the edge device in the building.
Every few secondsReadingsdt_queue · car · count=9 · wait_s=192 · model=track-v2 · conf=0.96

↺ Hard cases and dismissed alerts go back into the next round of training.

Industries

Built for operations that happen in physical space.

Each industry gets its own zones, metrics and dashboards, on the same platform.

A bakery café counter at lunchLine 5 · waiting 2:48
Available now

Quick-service restaurants

Drive-thru speed, guests who walk out, pans that run empty, crews where they're needed.

drive-thru timecapture ratewalk-outswaste $line wait
A warehouse loading dockDoor 7 · waiting 48 min
Available now

Warehouses and logistics

Detention and dock turns, labor cost per unit, idle lines, honeycombed racks.
dock turncost / unitdetention $
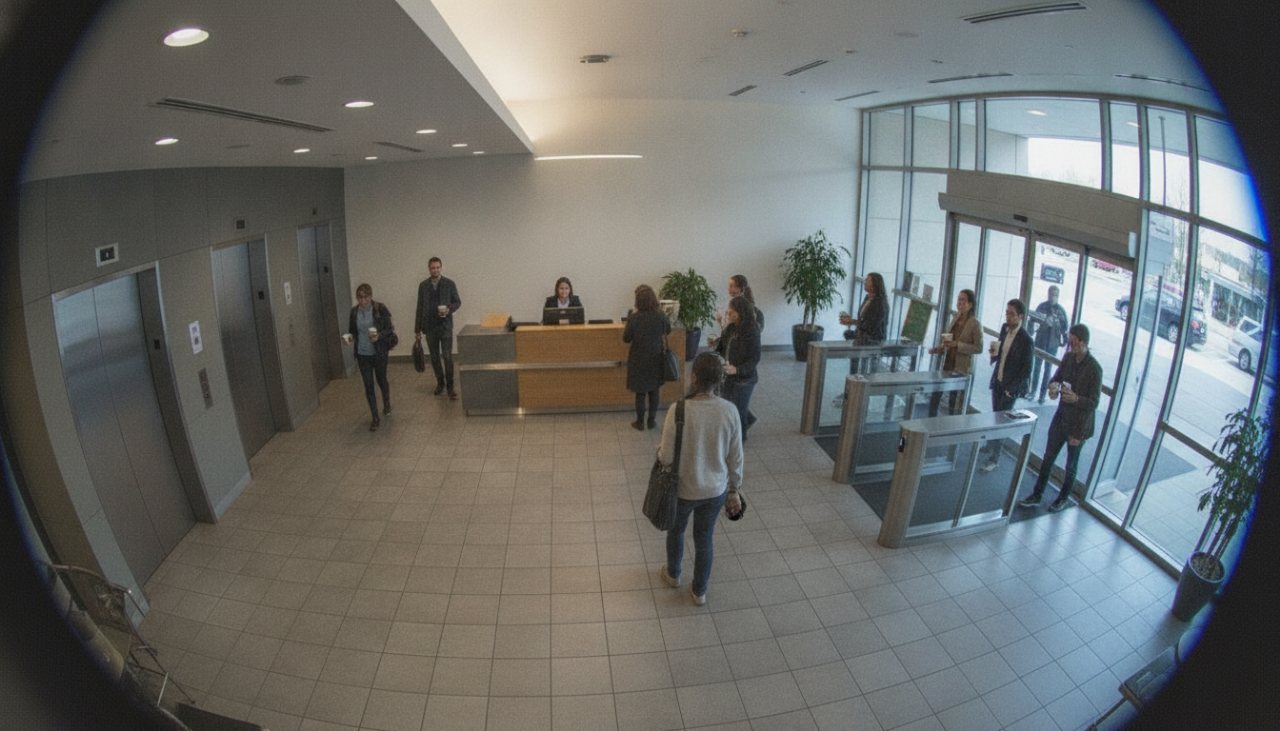
An office building lobby at 8:45 am seen from a ceiling cameraLobby · 142 in since 8:00
Early access

Commercial property

Lobby and amenity use, parking, loading zones and after-hours activity across a portfolio.
occupancyparkingamenity use
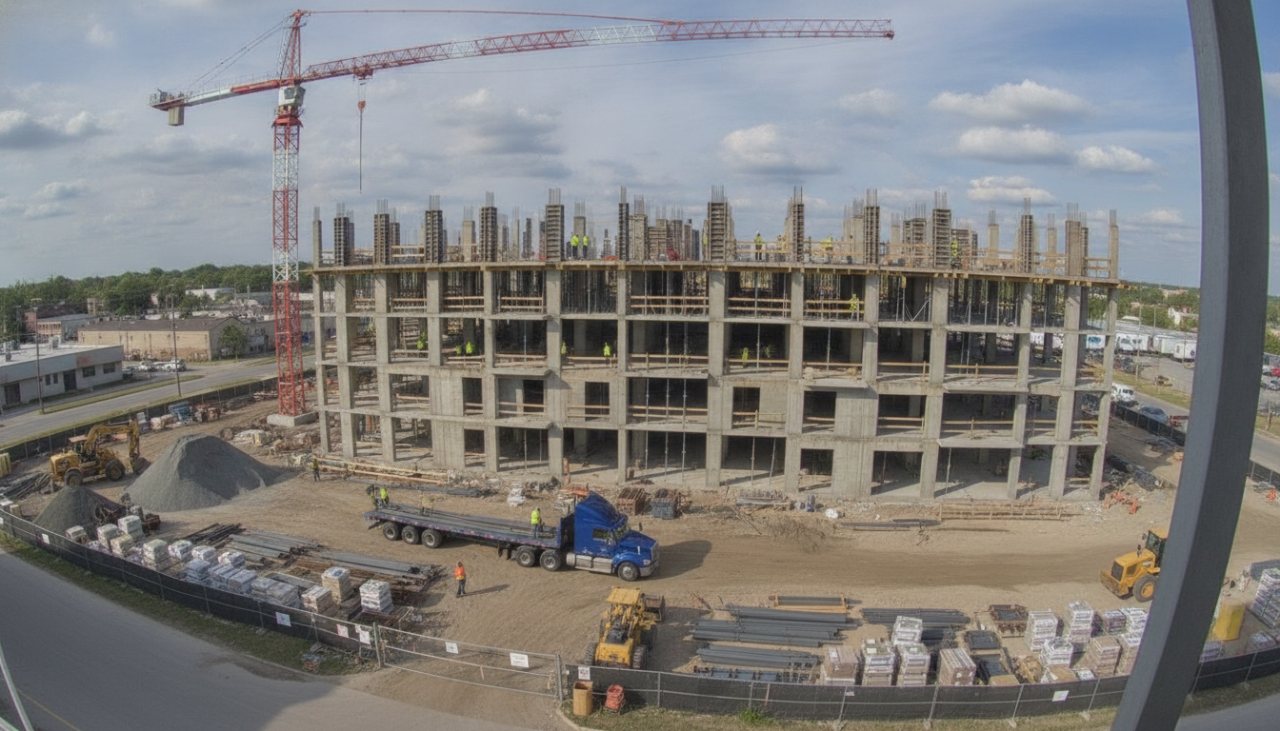
A mid-rise construction site seen from a pole cameraCrew on site · 38 · mixer at gate 24 min
Early access

Construction

Crews by trade and hour, rented machines that sit idle, deliveries waiting at the gate, exclusion zones and after hours, on every project.
crew hoursidle equipment $gate wait
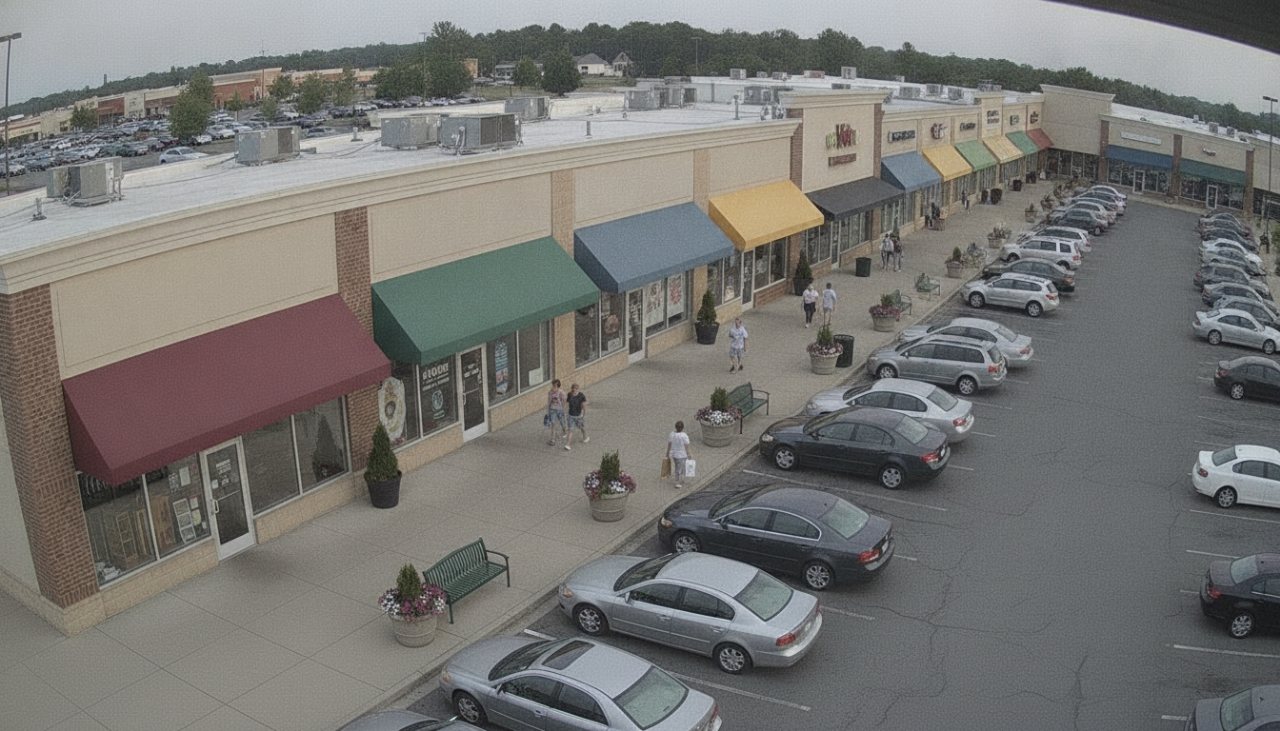
An open-air shopping center walkway with storefronts and shoppersFootfall 1,240 today · lot 71% full
Early access

Open-air retail

Footfall by entrance, parking turnover, dwell and tenant-level traffic for centers and their tenants.

footfalltenant captureparking
The product

Answers in dollars, down to the site and the hour.

Every number below is counted from store cameras by VideoBI's AI.

A café counter with five guests in line and two tables waiting to be clearedline 5 · waiting 2:48
Front counter camera
A holding cabinet with each pan outlined and its fill level read9 pans · 2 low
Holding cabinet camera
The VideoBI edge device66 cameras · 15 stores
VideoBI AI on site

Works with your recorderLatticeWork VaiSenseAI-ready

HikvisionLorexDahuaAmcrestUniviewHanwha WisenetAxisUniFi ProtectONVIF and RTSP camerasAll recorders →

✦Monthly close for the CFO: execution by store, lost sales, traffic and stockouts vs last monthGenerate
Demo QSR · Monthly review
Monthly close pack
September 2026 · 15 stores
Last monthAll storesExport PDFEdit

Execution index

85
No change vs prior

Lost sales

$316.3K
▼ -$24.1K vs prior

Door traffic

394.0K
▼ -33,258 vs prior

Capture rate

75%
▼ -0.1 pts vs prior

Execution index by store

Portfolio 86
Store 1499
Store 596
Store 395
Store 4094
Store 993
Store 1792
Store 2886
Store 2686
Store 2283
Store 3883
Store 1983
Store 1183
Store 4582
Store 3178
Store 759

Lost sales by store vs prior month

LocationValueCoveragePrior monthChange
Portfolio$316.3K99.0%$340.5K-$24.1K
Store 7$97.4K100.0%$102.3K▼ -$4.9K
Store 11$27.4K100.0%$31.0K▼ -$3.6K
Store 19$25.4K100.0%$29.1K▼ -$3.6K
Store 45$23.3K91.7%$25.4K▼ -$2.0K
Store 38$22.9K100.0%$24.8K▼ -$1.8K
Store 22$15.7K100.0%$16.9K▼ -$1.2K
Store 17$15.4K100.0%$15.8K▼ -$450
Store 9$14.7K97.9%$15.3K▼ -$700
Store 3$12.5K98.3%$13.7K▼ -$1.2K
Store 26$12.2K100.0%$14.1K▼ -$1.9K
Store 14$10.6K98.3%$10.5K▲ +$38
Store 40$10.5K100.0%$11.1K▼ -$625
Store 28$10.2K100.0%$11.4K▼ -$1.2K
Store 5$9.4K98.4%$9.7K▼ -$288
Store 31$8.7K100.0%$9.3K▼ -$613

Door traffic vs prior month

LocationInPrior monthChange
Portfolio393,962427,220-33,258
Store 734,39936,562▼ -2,163
Store 932,53334,611▼ -2,078
Store 330,16531,845▼ -1,680
Store 2628,81730,637▼ -1,820
Store 1127,71529,578▼ -1,863
Store 2226,83030,473▼ -3,643
Store 1926,10727,979▼ -1,872
Store 1726,08728,068▼ -1,981
Store 1425,74529,234▼ -3,489
Store 4024,53326,689▼ -2,156
Store 3823,40624,728▼ -1,322
Store 2823,32425,158▼ -1,834
Store 522,22823,379▼ -1,151
Store 4521,84026,399▼ -4,559
Store 3120,23321,880▼ -1,647

Capture rate vs prior month

LocationValuePrior monthChange
Portfolio74.7%74.8%-0.1 pts
Store 762.1%62.8%▼ -0.7 pts
Store 4570.8%72.1%▼ -1.3 pts
Store 1171.9%71.7%▲ +0.2 pts
Store 1972.0%72.1%▼ -0.1 pts
Store 3873.1%73.8%▼ -0.6 pts
Store 3176.1%76.4%▼ -0.3 pts
Store 2676.5%76.1%▲ +0.4 pts
Store 2876.6%76.4%▲ +0.2 pts
Store 976.8%76.7%▲ +0.1 pts
Store 4076.8%77.2%▼ -0.4 pts
Store 1777.2%77.0%▲ +0.2 pts
Store 2277.3%77.3%▼ -0.0 pts
Store 378.1%77.6%▲ +0.5 pts
Store 578.2%78.1%▲ +0.1 pts
Store 1479.9%80.0%▼ -0.1 pts

Out-of-stock minutes vs prior month

LocationMinutes below its low levelPrior monthChange
Portfolio74,40877,516-3,108
Store 2219,54420,711▼ -1,167
Store 174,6544,675▼ -21
Store 114,4534,465▼ -12
Store 194,4164,440▼ -24
Store 384,3964,520▼ -124
Store 74,3854,435▼ -50
Store 284,0053,960▲ +45
Store 313,9494,035▼ -86
Store 263,8653,945▼ -80
Store 93,5523,570▼ -18
Store 53,5493,545▲ +4
Store 403,5223,615▼ -93
Store 33,4923,565▼ -73
Store 453,3314,420▼ -1,089
Store 143,2953,615▼ -320

Monthly close pack, September 2026, from the sample restaurant chain in the live demo. Ask for live demo access →

Ask

Ask AI what your cameras see across every site.

Ask in plain language. VideoBI investigates across every site the way an analyst would, then answers with a verdict, the reasoning, and the evidence behind it.

  • Numbers come from the data. Every figure is a fact from an analysis run; hover it to see what it measured, where and when.
  • Evidence inline. Charts and camera stills sit between the paragraphs, ready to save as a dashboard.
  • It names its gaps. When an answer depends on data VideoBI doesn't have, such as sales, labor dollars or invoices, it says so.

Real questions and answers from the VideoBI live demo.

Security and governance

Designed to be trusted with what your cameras see.

Built for the security review of a large company, and for the people who work in your buildings.

Video stays on site

Edge devices process video locally. Only structured readings, and the stills you request, reach the cloud.

No facial recognition

VideoBI counts, times and locates. It does not identify people or track individuals across cameras.

Evidence on every number

Any figure can be traced to the zone, the time and the camera frame behind it.

Access by role and site

Executives, managers and crews see what their role and locations allow. Enterprise plans add SSO.

Tenant isolation

Every customer's data is separated at the database level, enforced on every query.

Retention you control

Set how long stills and clips are kept, blur people before upload, and audit who changed what.

Businesses run on data from their CRM, ERP and ledger, and video is the next source to add.

We are building the platform that makes video a first-class source of business intelligence, starting with restaurants and distribution, and opening new industries every year.

VideoBI is a division of LatticeWork, Inc., which builds edge AI devices and private cloud systems, with 130+ engineers.